
Humans have many talents, but flawless decision making is definitely not one of them. Can you really trust your own intuition when it comes to business growth? You’d probably rather rely on the facts and data, right?
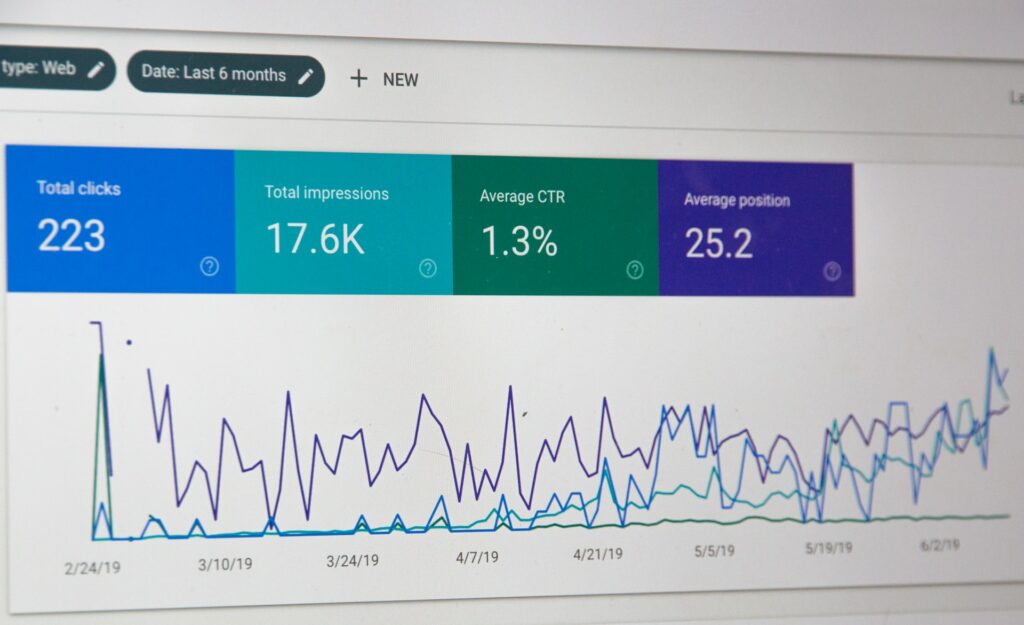
Of course, you would. Luckily, the market knows this as well, and provides a number of solutions that allow you to track and analyse your apps. You can choose from tools such as Google Analytics, Firebase, Mixpanel and Facebook Analytics.
Each of them provides a number of predefined dashboards that could be a good starting point. Nonetheless, settling for the insights they offer is one of the surest paths to business disaster. In this article, I’ll show you why.
What is the real purpose of Business Intelligence?
Business Intelligence (BI) basically transforms collected data into actionable insights in the form of domain-customised dashboards. The whole process is data-driven, which makes the decision-making more efficient, more powerful and more accurate.
Why should you care about proper analytics and BI? The reason is pretty straightforward. As a stakeholder, you want to know how your app performs. To this end, you need to answer a number of important questions e.g:
- Which features are used?
- What content is well-liked and what is not?
- What are the conversion rates for key target groups?
- How do users follow the critical paths of the app?
- When and why do they churn?
- When are they activated and how can you keep them engaged?
How is Business Intelligence helpful in the software development process?
A basic integration of even the best analytics tool won’t really give you much of the domain-specific statistics right out-of-the-box. For example, integrating Firebase gives you the number of active users, their demographics, devices or even opened screens.
But that doesn’t directly answer the stated questions, does it? Information on the number of installations or monthly active users is important, but these are rarely the actual goals of the app.
Why do you need more than a pre-made solution?
These tools are general, built to suit everyone. That means they’re really tailor-made for no one. They can’t aggregate data from different sources (like app database, CRM or market analysis), nor can they show you the metrics that are unique to your application. These tools provide a limited, incomplete picture of the situation that can be very misleading for your business. They also usually have a constrained ability to delve into collected data to try and understand the presented results.
Don’t get me wrong here. These tools are great and I recommend using them. They just need to be properly customised. If you want to get detailed insights on the content, monetisation (e.g. subscriptions) or user engagement, you need to carefully plan and implement custom analytic events. The next step would be to build custom BI dashboards utilising both collected events and data stored in your app’s database. Such dashboards can be used to visualise the most important numbers that answer these questions directly.
The impact of data-driven decisions
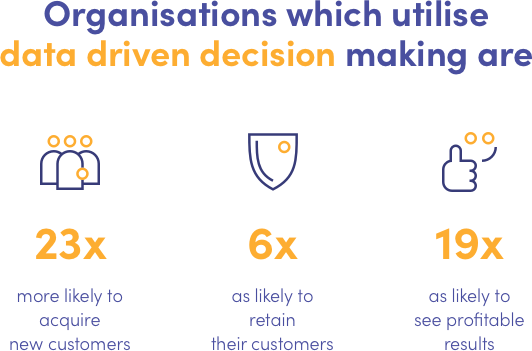
The McKinsey Global Institute has done research on how data-driven decision process influences the organisations that utilise it. These findings clearly confirm that checking your key metrics is indeed a must. But have you ever stopped and really considered which numbers define the success of your product? What is your North Star or growth function, as the growth hackers would put it?
Before you start building your analytics you have to clearly state your essential metrics. Most products will share a few common components of revenue growth. These could be new user acquisition, activation and retention. Nonetheless, every app has its own set of business-specific factors that influence revenue.
How to identify the factors that influence your revenue
Identify actions that most directly correlate with users experiencing the core value of your app. For Uber it might be rides completed, number of rides, number of riders rebooking a ride. For Facebook it could be the number of accepted invitations or number of added posts, comments and reactions.
The basic metrics provided by analytics tools are obviously valuable. They could include page views, number of installations or number of sessions. However, it is more important to track the metrics that matter for your product. Tools like Google Analytics provide hundreds of charts. Unfortunately, they often turn out to be more confusing than helpful.
Carefully plan your analytics
At this point, you might be tempted to just decide to “track everything” and make some sense of it later. This is a very common mistake. Doing so can lead straight to a disaster.
You might assume that you can easily have a complete picture of everything happening in your app. You just need to ask your development team to send events for every button and every action, right? Well…no.
What do you need data scientists for?
Sure, the developers would be happy to oblige by adding the selected SDK and implement event sending for every action. But what’s going to happen if they don’t have the bigger picture in mind? They will just recklessly send what they think might be important. You will surely end up with a lot of data, but it will be unstructured, chaotic and most likely missing key parameters. That is why it is so important to include data scientists in the process and create a data collection plan.
What is a data collection plan?
A data collection plan is basically a documentation of all events that need to be sent from the application. It only takes a few days of work from a data scientist to prepare one. This effort pays off during development time. That way, developers can simply follow the documentation without having to think about event implementation.
Learning from my own experience, I found out what works best here. Start creating your plan with a data collection and utilisation workshop with the data science team. During this meeting, you confirm your data collection goals. Then you go through your product to establish data points and settle the key metrics. Finally, you can discuss how they will be presented on the dashboards. Such a meeting will minimise the risk of misunderstandings.
Visualise what matters
Having worked on a few dozen software projects I’ve seen that decision-makers are all too prone to cutting corners on Business Intelligence. It’s a shame, as BI is the only tool that they can use to base their decisions on, drive growth and build a successful product. This attitude is often based on the mistaken assumption that if their idea for a product is right, it is just bound to be successful.
But the reality is very different. All successful products are constantly improved through data-driven experiments. The market is cruel—you snooze, you lose. That is why it is so important to constantly track the key metrics of your application. However, without skilful dashboard customisation, you will just get an overwhelming amount of unstructured logs. You will experience an information overload that will only discourage you from using BI.
How to avoid information overload
What you need is to clearly see the most important parameters at first glance. That way, you’re able to easily dive deeper into leveraging your data. That requires dashboard customisation. Based on these analytics you can build business intelligence dashboards. They will allow you to learn how users interact with the app, draw conclusions, and apply them in your business model.
You can do it to some extent using analytics tools like Google Analytics or Firebase. But more often than not you need to combine results from many different data sources and create custom BI dashboards. Below you can see an example of a very simple, yet informative, custom dashboard created in Google Data Studio.
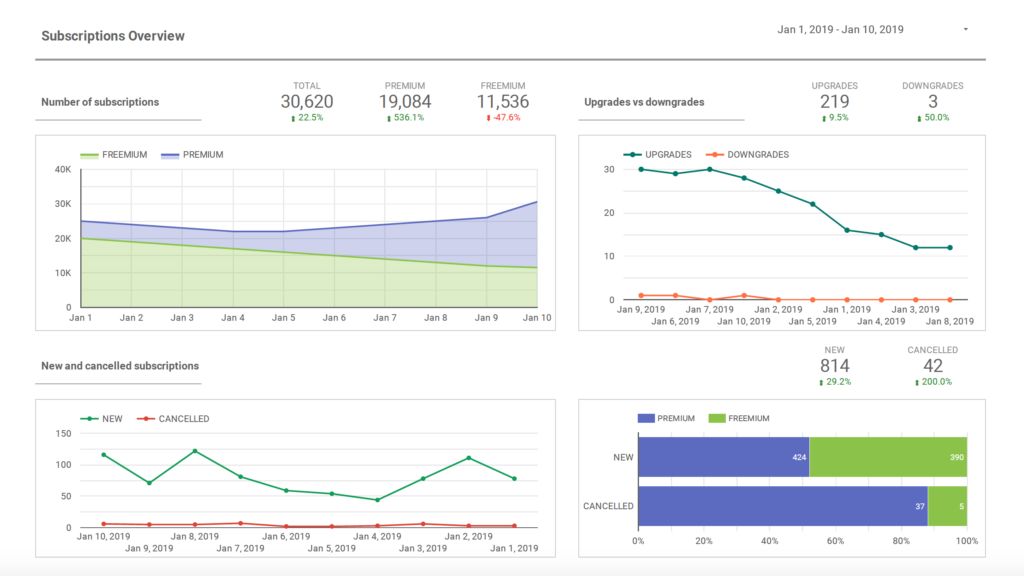
As you can imagine, such a dashboard is relatively easy for an experienced data scientist to create. It usually takes up to a few days to create one in tools like Tableau, Graphana, Google Data Studio or Power BI. It’s next to nothing compared to the overall effort that goes into software product implementation. When you consider their added value, custom dashboards are definitely not something to compromise on.
Don’t go out blind into the market
I can’t emphasise enough how crucial it is to have at least analytics in place when the app goes live. Otherwise, you will lose your only chance to get key insights on the app when they are most needed, i.e. when the app is verified on the market. Proper data analytics are surprisingly cheap when it comes to the required implementation time. Still, it is somehow often neglected by businesses settling for the simplest solutions.
You need to collect and visualise your data in a way that will easily communicate how your app is performing. Don’t settle for anything less. You don’t want to find yourself falling behind and not even knowing the reason why. Much as a pilot can’t fly an aeroplane without proper instruments that constantly monitor crucial flight parameters, without the right data analysis and presentation you will be flying blind.
Hungry for more?
Searching for the right Business Intelligence strategy for your company? Let’s see what we can do! Contact the author at hello@miquido.com

Top AI innovations delivered monthly!
The administrator of your personal data is Miquido sp. z o.o. sp.k., with its ... registered office in Kraków at Zabłocie 43A, 30 - 701. We process the provided information in order to send you a newsletter. The basis for processing of your data is your consent and Miquido’s legitimate interest. You may withdraw your consent at any time by contacting us at marketing@miquido.com. You have the right to object, the right to access your data, the right to request rectification, deletion or restriction of data processing. For detailed information on the processing of your personal data, please see Privacy Policy.


